Data Packages & Reports
Mission Fulfillment Indicator Scorecards
The indicators are assessable and verifiable statements and statistics that help identify how we measure mission fulfillment and make progress in key areas. Four thematic headings represent the major areas of Lane’s mission. With the addition of the last thematic heading the MFIs are aligned with Lane’s Strategic Plan 2022-2027. Themes:
- Community Service and Engagement
- Accessible & Equitable Learning Opportunities
- Quality Educational Environment
- Individual Student Achievement
- Institutional Health, Wellness, and Sustainability
Mission fulfillment is defined as the realization of these themes. The College undertakes a regular review of pertinent data to determine the extent to which Lane has made progress towards these goals, as measured by the indicators. Mission fulfillment will be evaluated against a benchmark of 70% of indicators at or above established thresholds within each of the themes. Please note that many of the indicators will assess access and equity since wherever possible they will be disaggregated by student demographics in accordance with NWCCU Standard 1.D.2.
Institution-wide Mission Fulfillment Indicators (MFIs) were voted on and accepted by the Institutional Effectiveness Commission, February 2020 and are updated annually.
Each MFI includes a Scorecard. They help measure mission fulfillment and increase understanding of the indicators. Each two-page snapshot includes an overview, discussion and investigation into the supporting data, peer comparison (when applicable and available), lessons learned and next steps. MFIs and Scorecards are listed below.
Economic Impact Reports
Lane promotes economic growth in the Lane Service District through its direct expenditures and the resulting expenditures of students and regional businesses. The college serves as an employer and buyer of goods and services for its day-to-day operations. The college’s activities attract students from outside the Lane Service District, whose expenditures benefit regional vendors. In addition, Lane is a primary source of higher education to the Lane Service District residents and a supplier of trained workers to regional industries, enhancing overall productivity in the regional workforce.
Guided Pathways Metrics
Welcome to Guided Pathways Data Dashboards! Many of these dashboards focus on Early Momentum Metrics (EMMs), and one set of dashboards focuses on longer term outcomes.
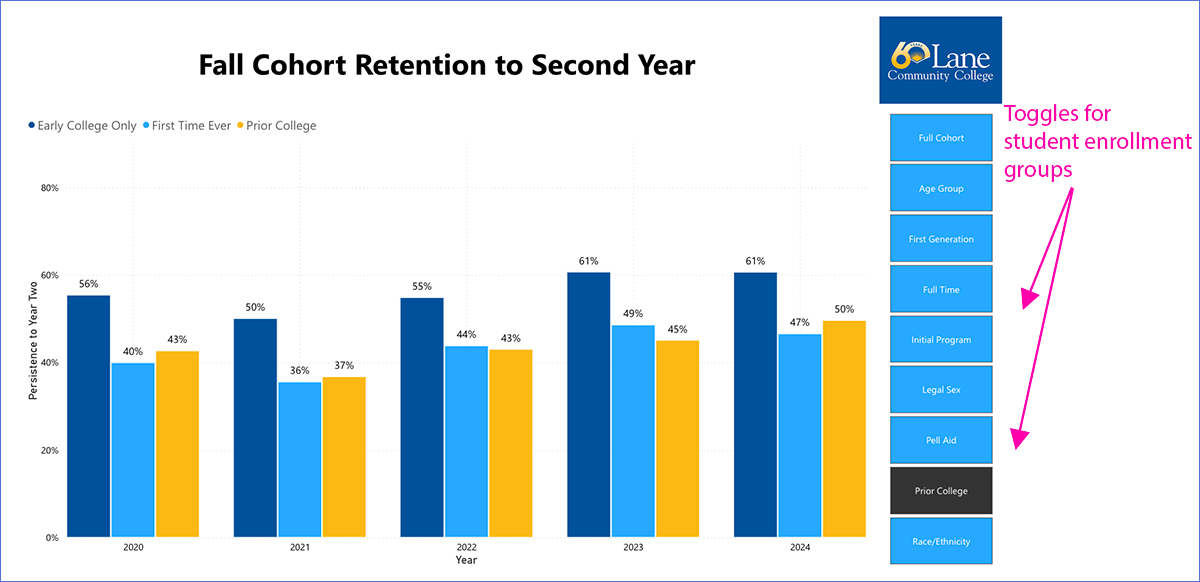
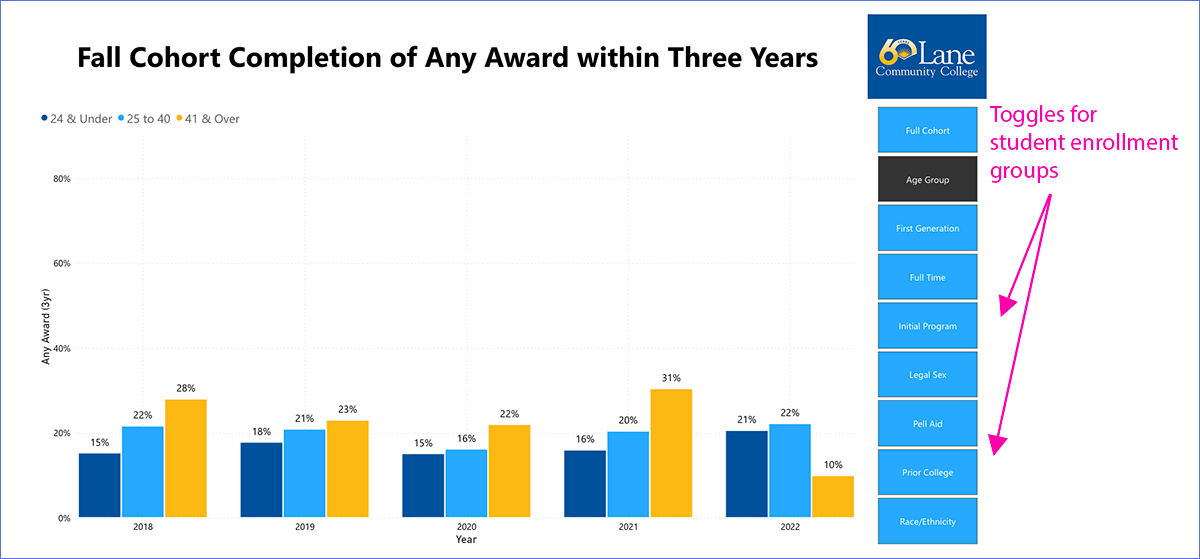
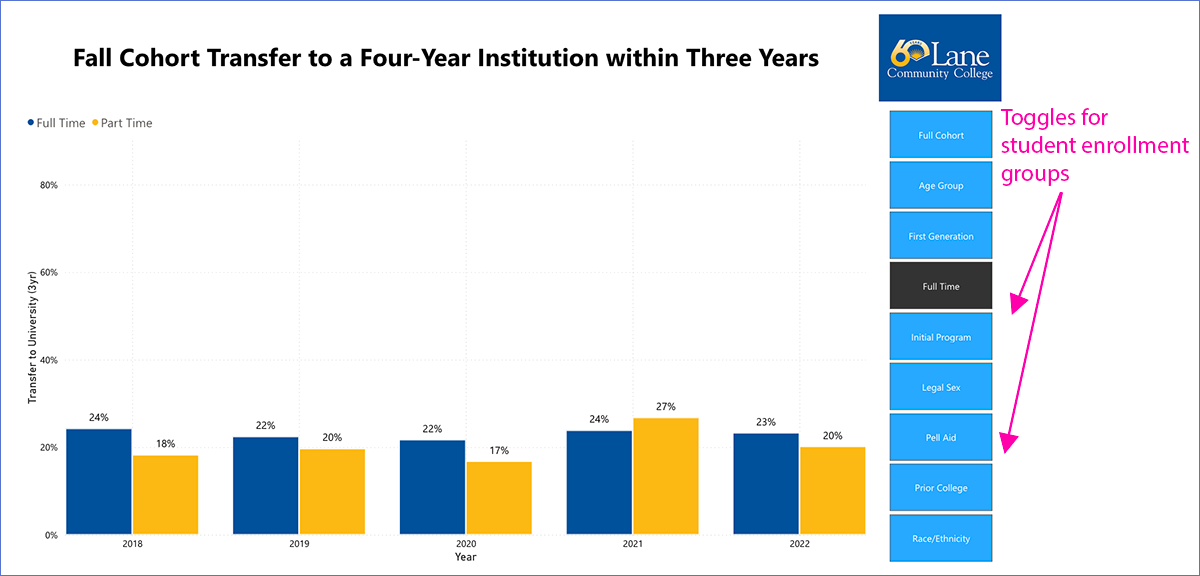
EMMs are important because they are leading indicators of later student outcomes. Change in success rates on EMMs can be monitored at shorter intervals, such as quarterly or annually, to help us identify whether intended improvements in our processes and/or systems are likely to have subsequent positive impacts on lagging outcomes, such as completion or transfer. EMMs are displayed on dashboards showing Gateway Course success rates and First Term Metrics. The three Gateway Course dashboards show the rates at which Lane students take and pass program-level math and writing courses within their first year. The three First Term Metrics dashboards show how many credits Lane students successfully complete, and persistence rates from fall to winter term. The three Persistence and Completion dashboards show the rate at which Lane students are retained from the first to the second year, and the completion of any award (degree or certificate) and success transferring to a four-year institution within three years. On each page, data can be disaggregated by multiple factors.
We are excited to provide this data, with disaggregation, for your exploration, review, pondering, and discussion with others. We encourage you to actively engage with the data, and use it to prompt questioning, problem solving, and visioning and action toward the development of ideal future student experiences. Thank you for taking the time to dig into some data!
The Guided Pathways Core Team – guidedpathways@lanecc.edu
Power BI Dashboards
Public Access
A number of Power BI dashboards are available to everyone at Lane (i.e., all with a valid LCC email address) and are part of a service being developed through a collaboration between Institutional Research and IT. If you would like more information on the data presented or some guidance on usage, please contact Cathy Thomas or Keith Comer.
Each of the following linked PowerBI dashboards have settings that can be "toggled" to present different student groups, time periods, or other information.
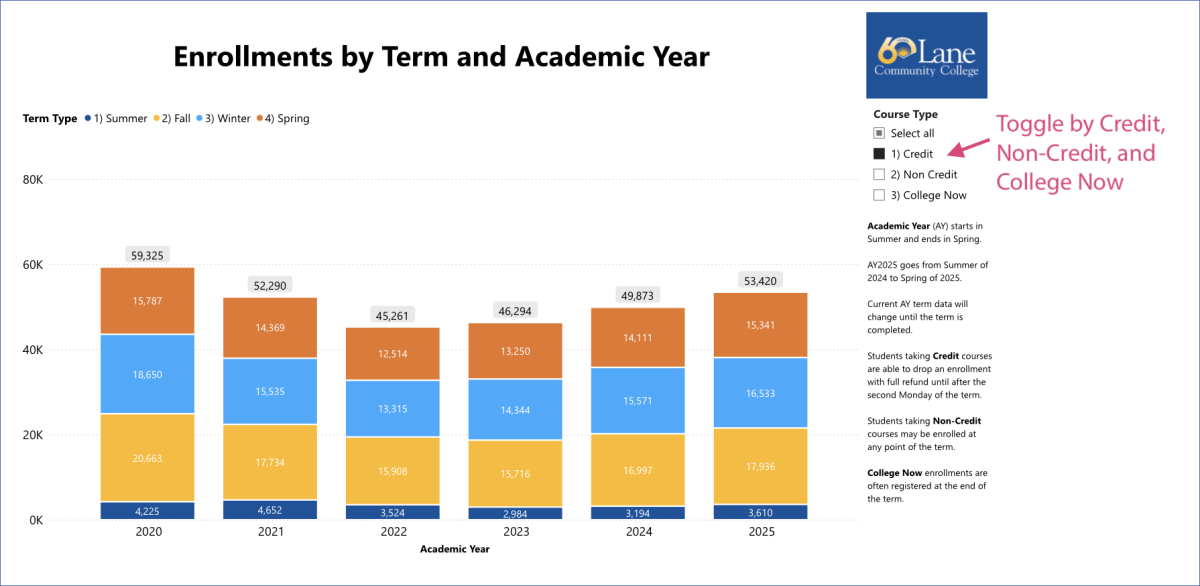
Enrollments by Term and Academic Year
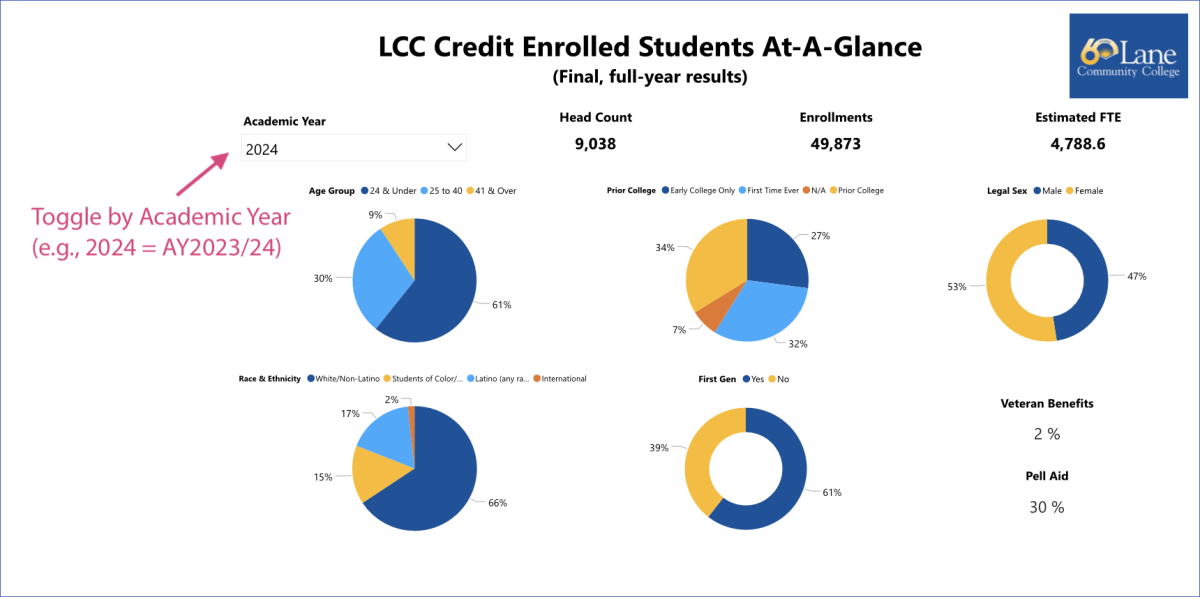
LCC Credit Enrolled Students At-a-glance
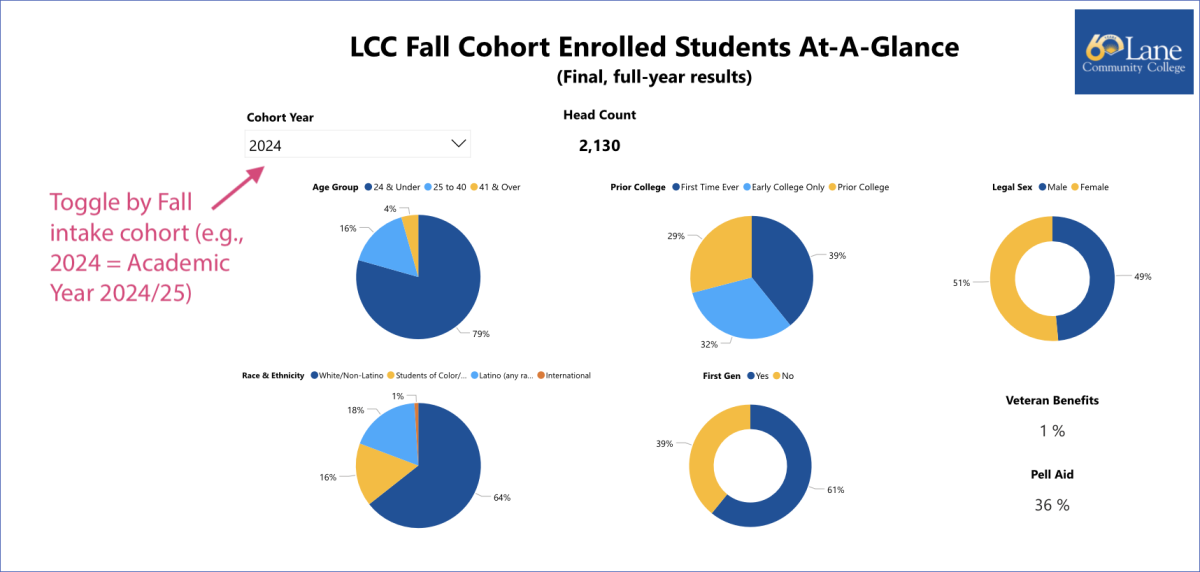
LCC Fall Cohort Enrolled Students At-a-glance
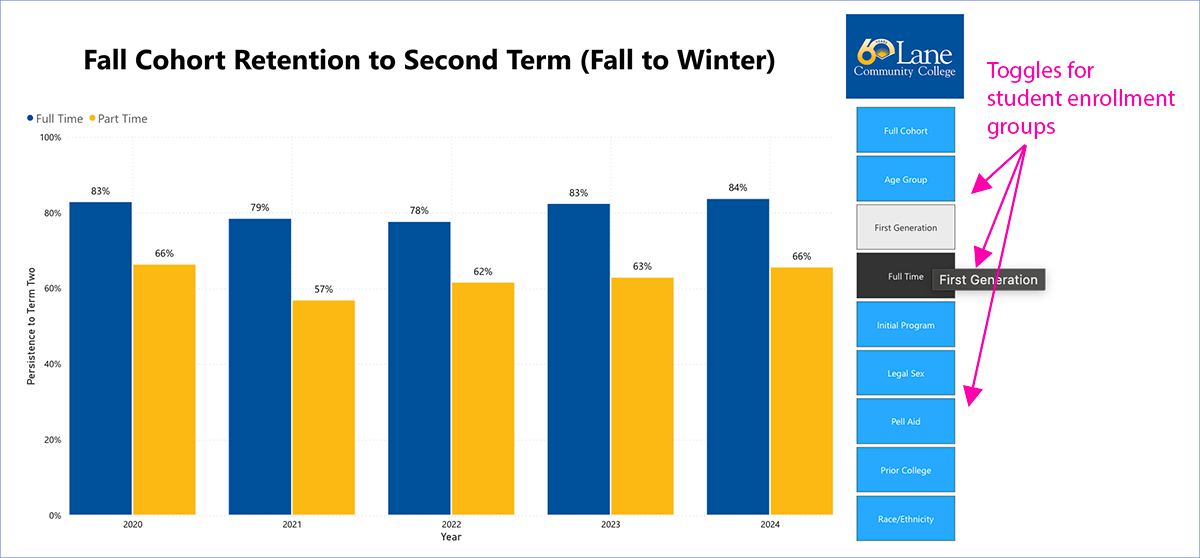
Fall Cohort Retention to Second Term (Fall to Winter)
Fall Cohort Retention to Second Year (Fall to following Fall)
Fall Cohort Completion of Any Award within Three Years
Fall Cohort Transfer to a Four-Year Institution within Three Years
Previous:
Credit Student Enrollment by Year
Enrollment by Term and Year
Student Data Conferred Awards
Internal Use Only
Some Power BI dashboards are password-protected. If you are a member of any of the groups below, you can access the dashboards via your LCC Microsoft password. If you would like more information on the data presented or some guidance on usage, please contact Cathy Thomas or Keith Comer. Login reset information is available via the login link (for access problems only, please contact Brandon Gibson.
Board Sharepoint
Cabinet Sharepoint
Deans and Directors Sharepoint
Standard Data Package
"Faculty, staff, and managers regularly review, analyze and engage with both standard data elements and department-specific performance measures through annual department planning and five-year program review processes. These processes result in a cycle of continuous improvement, planning and assessment."
– Lane Community College 2017-2022
Long-Range Financial Planning Report
The tabs in the workbook available to download below contain the elements of the college’s standard data package. This data is designed to be used as a reference and resource for department planning, program review, and access to common questions and information requests.
It is through the processes of department planning and program review that faculty, staff and managers develop context, meaning and improvement plans out of this large data set.
- 2022 Standard Data Package – (Updated_12-6-22) – for LCC Employees, use your L# and password
- 2021 Standard Data Package – (updated 3-31-22) – for LCC Employees, use your L# and password
- 2020 Standard Data Package – (updated 1-29-21) – for LCC Employees, use your L# and password
Institutional Research and Budget Office staff are available to answer and will collect feedback and suggestions for enhancements and improvements to the standard data package for subsequent releases.
Institutional Research and Budget Office staff are also available for one-on-one consultations and/or discussion at department or group meetings.
Contacts:
General Information and scheduling of individual or group appointments: Cathy Thomas ext. 5779
Student Enrollment, Demographics and Success data: Cathy Thomas ext. 5779
Staffing and Financial data: Kara Flath
Employment data: Cathy Thomas ext. 5779
Regional and National Benchmarked Data
Per the NWCCU’s Peer Institutions and Benchmarking Purpose and Frequently Asked Questions guidance, Lane benchmarks student achievement efforts by comparing Lane’s student achievement data to 4 regional and 10 national peer institutions. These colleges were selected based on:
- headcount and FTE,
- comparable mix of instructional program offerings (mix of transfer and professional/technical programs),
- comparable student demographics, service to a similar population, and institution location.
IPEDS was useful in narrowing down colleges based on these factors. Once the initial list of potential peer colleges had been identified and a group of stakeholders agreed upon these 14 institutions – four regional and ten national institutions.
IPEDS
The Integrated Postsecondary Education Data System (IPEDS) is a system of interrelated surveys conducted annually by the National Center for Education Statistics, U.S. Department of Education. IPEDS consists of twelve interrelated survey components that are collected each year. The completion of all IPEDS surveys is mandatory for all institutions that participate in any federal financial assistance program authorized by Title IV of the Higher Education Act of 1965.
Annually, IPEDS creates a customized Data Feedback Report, a report that graphically summarizes selected institutional data and compares the data with peer institutions. Additionally, you can access IPEDS data submitted by over 7,000 institutions through the NCES data tools.
- IPEDS Data Report 2023
- IPEDS Data Report 2022
- IPEDS Data Report 2021
- IPEDS Data Report 2020
- IPEDS Data Report 2019
- IPEDS Data Report 2018
- IPEDS Data Report 2017
- IPEDS Data Report 2016
- IPEDS Data Report 2015
- IPEDS Data Report 2014
- IPEDS Data Report 2013
- IPEDS Data Report 2012
- IPEDS Data Report 2011
- IPEDS Data Report 2010
- IPEDS Data Report 2009
- IPEDS Data Report 2008
Voluntary Framework of Accountability (VFA)

The Voluntary Framework of Accountability (VFA) is the first comprehensive national accountability system created by community colleges, for community colleges. Community college leaders —facilitated by the American Association of Community College (AACC)—conceived, developed, and pilot-tested the VFA metrics.
- VFA Brochure - Description of the VFA and its cohorts and measures with Community College Measures of Effectiveness
- VFA Snapshot - Listing of the VFA measures and a snapshot of the VFA system
