
Faculty & Staff
Staff by Employee Group
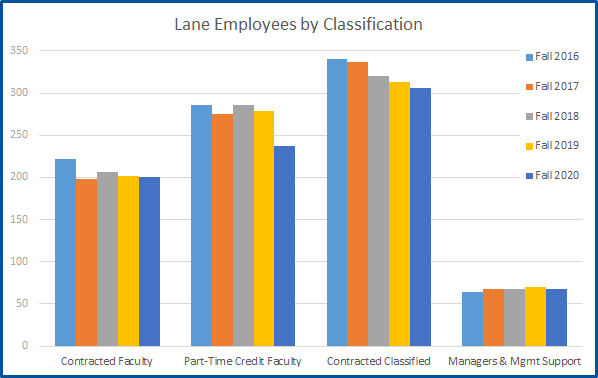
Lane has seen a percent change of 11.2% from Fall 2016 to Fall 2020. Specific employee classification showed the following percent change during that same time period: part-time credit faculty -17.1%, contract classified staff -10.3%, contracted faculty -9.9%, and managers & management support increased by 6.3%.
| Fall 2016 | Fall 2017 | Fall 2018 | Fall 2019 | Fall 2020 | |
|---|---|---|---|---|---|
| Contracted Faculty | 222 | 198 | 207 | 202 | 200 |
| Part-Time Credit Faculty | 286 | 275 | 286 | 279 | 237 |
| Contracted Classified | 341 | 337 | 320 | 313 | 306 |
| Managers & Management Support | 64 | 68 | 68 | 70 | 68 |
Staff by Gender
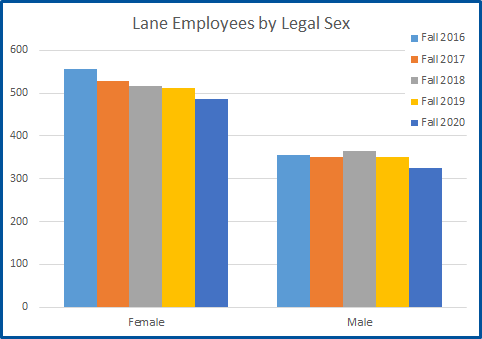
Lane's employee legal sex breakout has remained fairly consistent over the past 5 years, with a 1% decrease in females from Fall 2016 to Fall 2020.
| Fall 2016 | Fall 2017 | Fall 2018 | Fall 2019 | Fall 2020 | |
|---|---|---|---|---|---|
| Female | 557 | 528 | 517 | 512 | 486 |
| Male | 356 | 350 | 364 | 351 | 325 |
Staff by Ethnicity
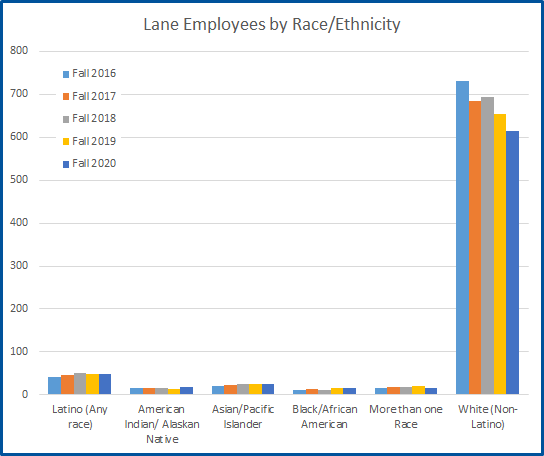
The race/ethnicity of Lane’s employees has changed over the past 5 years. The percent of change of minority employees has increased by 16% from Fall 2016 to Fall 2020.
| Latino (Any race) | American Indian/ Alaskan Native | Asian/ Pacific Islander | Black/African American | More than one Race | White (Non-Latino) | |
|---|---|---|---|---|---|---|
| Fall 2016 | 41 | 16 | 21 | 10 | 16 | 730 |
| Fall 2017 | 45 | 15 | 22 | 13 | 17 | 685 |
| Fall 2018 | 51 | 15 | 24 | 12 | 17 | 694 |
| Fall 2019 | 49 | 14 | 25 | 15 | 21 | 654 |
| Fall 2020 | 48 | 17 | 25 | 15 | 16 | 615 |
Need more specific info?
Email us!