Student Demographics and Enrollment
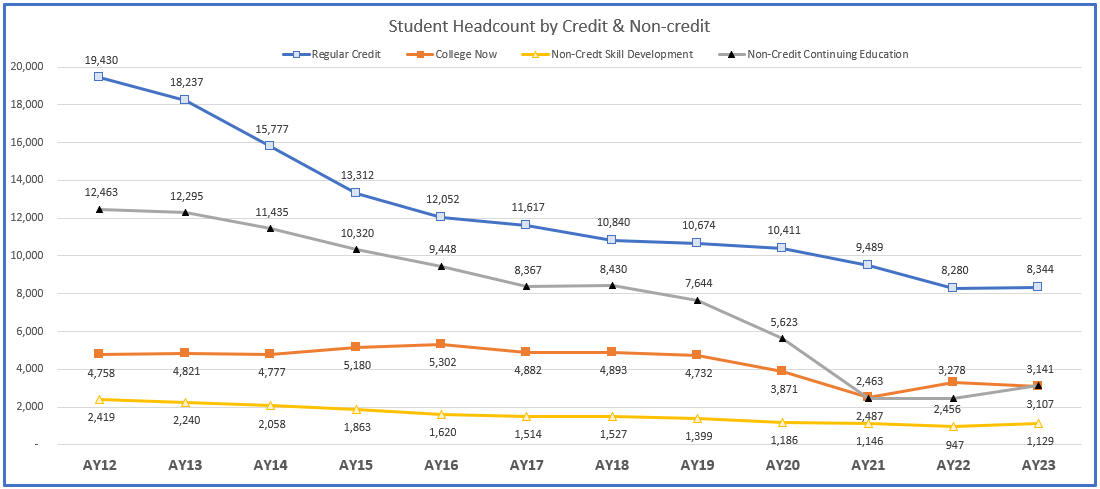
Student Headcount

Unduplicated student headcount data above is based on all enrollment attempts, this includes all attempted coursework, even if the student withdrew after the first week. Regular Credit is defined here as a student enrolled in credit classes other than College Now. College Now is defined here as students currently enrolled in area high schools earning Lane credits. Non-Credit Skill Development is defined here as a student who enrolled only in non-credit classes, including at least one ABSE, GED or ESL class. Non-Credit Continuing Education is defined here as all other students who enrolled strictly in non-credit classes in a given year. This includes both "professional development" and "extended learning" classes at all locations.
| Academic Year | AY13 | AY14 | AY15 | AY16 | AY17 | AY18 | AY19 | AY20 | AY21 | AY22 | AY23 |
| Regular Credit | 18,237 | 15,777 | 13,312 | 12,052 | 11,617 | 10,840 | 10,674 | 10,411 | 9,489 | 8,280 | 8,344 |
| College Now | 4,821 | 4,777 | 5,180 | 5,302 | 4,882 | 4,893 | 4,732 | 3,871 | 2,487 | 3,278 | 3,107 |
| Non-Credit Skill Development | 2,240 | 2,058 | 1,863 | 1,620 | 1,514 | 1,527 | 1,399 | 1,186 | 1,146 | 947 | 1,129 |
| Non-Credit Continuing Education | 12,295 | 11,435 | 10,320 | 9,448 | 8,367 | 8,430 | 7,644 | 5,623 | 2,463 | 2,456 | 3,141 |
Credit Student Demographics
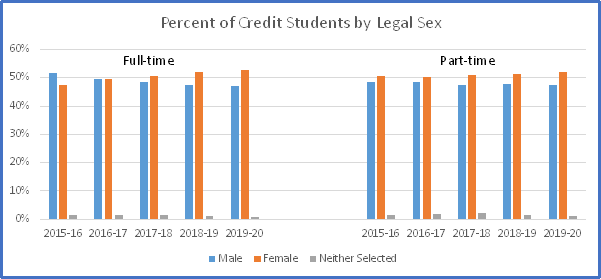
Credit Students by Legal Sex

| 2015-16 | 2016-17 | 2017-18 | 2018-19 | 2019-20 | ||
|---|---|---|---|---|---|---|
| full | Male | 1,327 | 1,229 | 1,118 | 1,081 | 1,009 |
| Time | Female | 1,216 | 1,223 | 1,166 | 1,186 | 1,127 |
| Neither Selected | 34 | 32 | 34 | 26 | 13 | |
| Part | Male | 4,679 | 4,444 | 4,067 | 4,045 | 3,940 |
| Time | Female | 4,878 | 4,617 | 4,365 | 4,366 | 4,342 |
| Neither Selected | 123 | 142 | 165 | 108 | 89 |
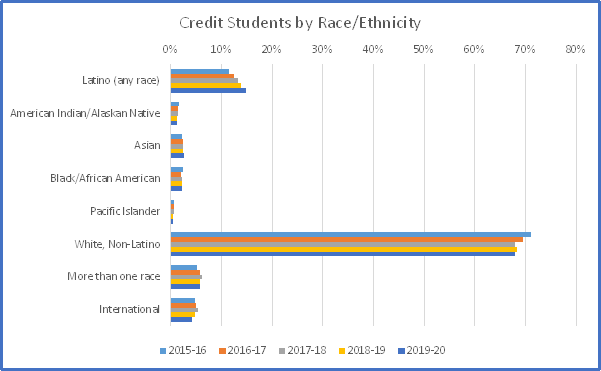
Credit Students by Race/Ethnicity

| Race/Ethnicity | 2015-16 | 2016-17 | 2017-18 | 2018-19 | 2019-20 |
| Latino (any race) | 1,317 | 1,383 | 1,377 | 1,452 | 1,519 |
| American Indian/Alaskan Native | 200 | 170 | 163 | 140 | 141 |
| Asian | 272 | 269 | 247 | 258 | 266 |
| Black/African American | 283 | 229 | 238 | 247 | 238 |
| Pacific Islander | 74 | 74 | 66 | 58 | 61 |
| White, Non-Latino | 8,165 | 7,661 | 7,013 | 7,106 | 6,952 |
| More than one race | 597 | 645 | 638 | 618 | 591 |
| International | 561 | 559 | 569 | 498 | 435 |
| Unknown | 788 | 697 | 604 | 435 | 317 |
| Total | 12,257 | 11,687 | 10,915 | 10,812 | 10,520 |
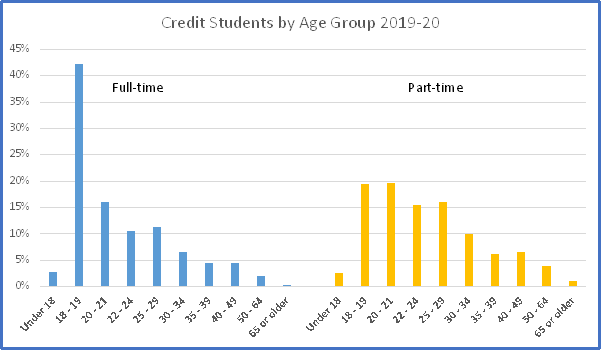
Credit Students by Age Group

| Age Group | AY16 | AY17 | AY18 | AY19 | AY20 | |
| Under 18 | 52 | 42 | 50 | 57 | 59 | |
| 18-19 | 727 | 857 | 899 | 902 | 904 | |
| 20-21 | 476 | 458 | 426 | 366 | 342 | |
| Full-Time | 22-24 | 313 | 310 | 265 | 283 | 224 |
| Credit | 25-29 | 387 | 311 | 278 | 263 | 243 |
| (36+) | 30-34 | 258 | 205 | 151 | 158 | 141 |
| 35-39 | 140 | 119 | 84 | 95 | 95 | |
| 40-49 | 153 | 117 | 110 | 107 | 96 | |
| 50-64 | 65 | 60 | 53 | 60 | 42 | |
| 65 or older | 6 | 5 | 2 | 2 | 3 | |
| Total | 2,577 | 2,484 | 2,318 | 2,293 | 2,149 | |
| Under 18 | 144 | 160 | 159 | 189 | 211 | |
| 18-19 | 1,637 | 1,652 | 1,617 | 1,574 | 1,615 | |
| 20-21 | 1,776 | 1,730 | 1,618 | 1,622 | 1,633 | |
| Part-Time | 22-24 | 1,692 | 1,597 | 1,536 | 1,423 | 1,282 |
| Credit | 25-29 | 1,575 | 1,491 | 1,390 | 1,437 | 1,331 |
| (<36) | 30-34 | 926 | 866 | 810 | 779 | 827 |
| 35-39 | 587 | 559 | 481 | 505 | 519 | |
| 40-49 | 741 | 671 | 570 | 566 | 545 | |
| 50-64 | 529 | 410 | 352 | 324 | 318 | |
| 65 or older | 72 | 67 | 64 | 96 | 86 | |
| Total | 9,679 | 9,203 | 8,597 | 8,515 | 8,367 |
Enrollment Dashboard-Lane Employees Only
Need more specific info?
Email us!
