Looking for data about Lane students and programs? Here you’ll find reports on demographics, enrollment, graduation, and transfer outcomes.
Need more specific info?
Email us!
Student Demographics and Enrollment
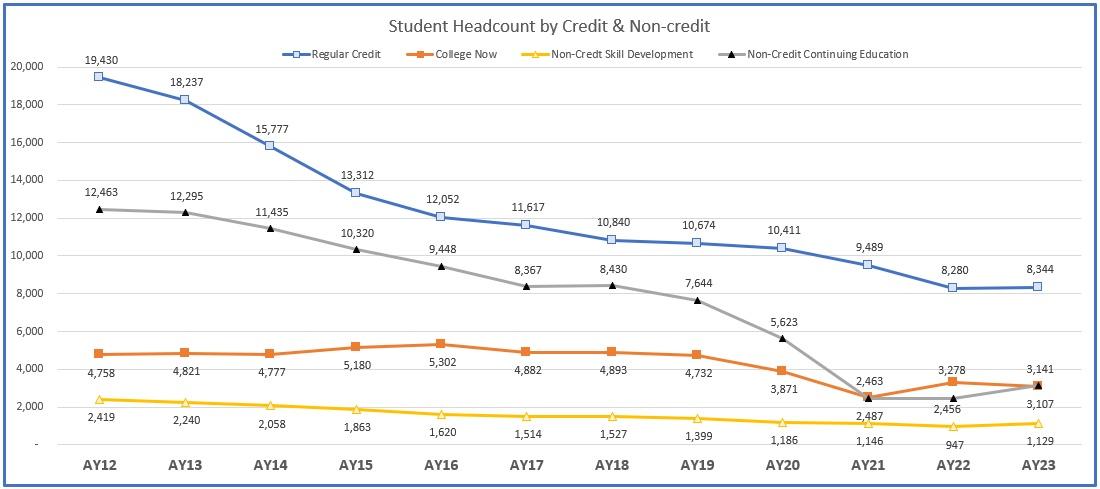
Unduplicated student headcount data above is based on all enrollment attempts, this includes all attempted coursework, even if the student withdrew after the first week. Regular Credit is defined here as a student enrolled in credit classes other than College Now. College Now is defined here as students currently enrolled in area high schools earning Lane credits. Non-Credit Skill Development is defined here as a student who enrolled only in non-credit classes, including at least one ABSE, GED or ESL class. Non-Credit Continuing Education is defined here as all other students who enrolled strictly in non-credit classes in a given year. This includes both "professional development" and "extended learning" classes at all locations.
| Academic Year | AY13 | AY14 | AY15 | AY16 | AY17 | AY18 | AY19 | AY20 | AY21 | AY22 | AY23 |
|---|---|---|---|---|---|---|---|---|---|---|---|
| Regular Credit | 18,237 | 15,777 | 13,312 | 12,052 | 11,617 | 10,840 | 10,674 | 10,411 | 9,489 | 8,280 | 8,344 |
| College Now | 4,821 | 4,777 | 5,180 | 5,302 | 4,882 | 4,893 | 4,732 | 3,871 | 2,487 | 3,278 | 3,107 |
| Non-Credit Skill Development | 2,240 | 2,058 | 1,863 | 1,620 | 1,514 | 1,527 | 1,399 | 1,186 | 1,146 | 947 | 1,129 |
| Non-Credit Continuing Education | 12,295 | 11,435 | 10,320 | 9,448 | 8,367 | 8,430 | 7,644 | 5,623 | 2,463 | 2,456 | 3,141 |
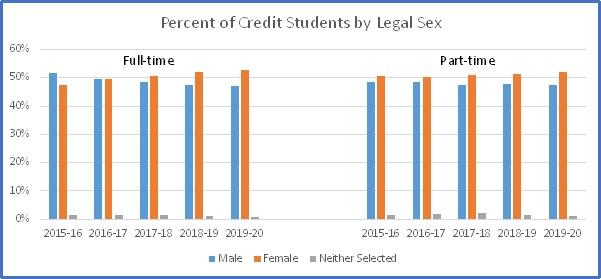
Full-Time, Credit Students by Legal Sex
| Gender | 2015-16 | 2016-17 | 2017-18 | 2018-19 | 2019-20 |
|---|---|---|---|---|---|
| Male | 1,327 | 1,229 | 1,118 | 1,081 | 1,009 |
| Female | 1,216 | 1,223 | 1,166 | 1,186 | 1,127 |
| Neither Selected | 34 | 32 | 34 | 26 | 13 |
Part-Time, Credit Students by Legal Sex
| Gender | 2015-16 | 2016-17 | 2017-18 | 2018-19 | 2019-20 |
|---|---|---|---|---|---|
| Male | 4,679 | 4,444 | 4,067 | 4,045 | 3,940 |
| Female | 4,878 | 4,617 | 4,365 | 4,366 | 4,342 |
| Neither Selected | 123 | 142 | 165 | 108 | 89 |
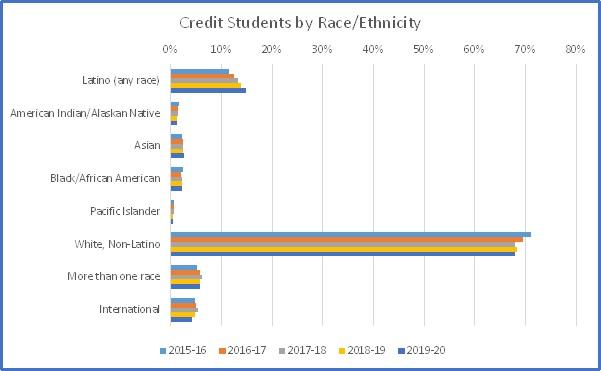
Credit Students by Race/Ethnicity
| Race/Ethnicity | 2015-16 | 2016-17 | 2017-18 | 2018-19 | 2019-20 |
|---|---|---|---|---|---|
| Latino (any race) | 1,317 | 1,383 | 1,377 | 1,452 | 1,519 |
| American Indian/Alaskan Native | 200 | 170 | 163 | 140 | 141 |
| Asian | 272 | 269 | 247 | 258 | 266 |
| Black/African American | 283 | 229 | 238 | 247 | 238 |
| Pacific Islander | 74 | 74 | 66 | 58 | 61 |
| White, Non-Latino | 8,165 | 7,661 | 7,013 | 7,106 | 6,952 |
| More than one race | 597 | 645 | 638 | 618 | 591 |
| International | 561 | 559 | 569 | 498 | 435 |
| Unknown | 788 | 697 | 604 | 435 | 317 |
| Total | 12,257 | 11,687 | 10,915 | 10,812 | 10,520 |
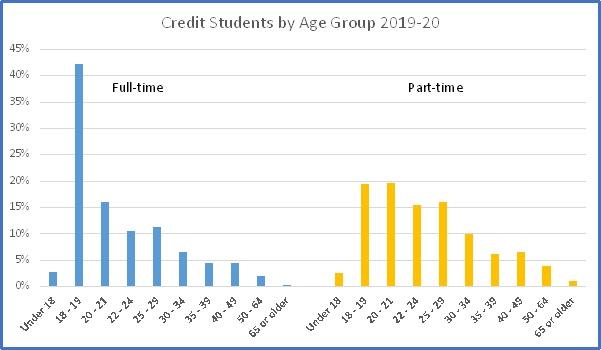
Full-Time, Credit Students by Age Group
| Age Group | AY16 | AY17 | AY18 | AY19 | AY20 |
|---|---|---|---|---|---|
| Under 18 | 52 | 42 | 50 | 57 | 59 |
| 18-19 | 727 | 857 | 899 | 902 | 904 |
| 20-21 | 476 | 458 | 426 | 366 | 342 |
| 22-24 | 313 | 310 | 265 | 283 | 224 |
| 25-29 | 387 | 311 | 278 | 263 | 243 |
| 30-34 | 258 | 205 | 151 | 158 | 141 |
| 35-39 | 140 | 119 | 84 | 95 | 95 |
| 40-49 | 153 | 117 | 110 | 107 | 96 |
| 50-64 | 65 | 60 | 53 | 60 | 42 |
| 65 or older | 6 | 5 | 2 | 2 | 3 |
| Total | 2,577 | 2,484 | 2,318 | 2,293 | 2,149 |
Part-Time, Credit Students by Age Group
| Age Group | AY16 | AY17 | AY18 | AY19 | AY20 |
|---|---|---|---|---|---|
| Under 18 | 144 | 160 | 159 | 189 | 211 |
| 18-19 | 1,637 | 1,652 | 1,617 | 1,574 | 1,615 |
| 20-21 | 1,776 | 1,730 | 1,618 | 1,622 | 1,633 |
| 22-24 | 1,692 | 1,597 | 1,536 | 1,423 | 1,282 |
| 25-29 | 1,575 | 1,491 | 1,390 | 1,437 | 1,331 |
| 30-34 | 926 | 866 | 810 | 779 | 827 |
| 35-39 | 587 | 559 | 481 | 505 | 519 |
| 40-49 | 741 | 671 | 570 | 566 | 545 |
| 50-64 | 529 | 410 | 352 | 324 | 318 |
| 65 or older | 72 | 67 | 64 | 96 | 86 |
| Total | 9,679 | 9,203 | 8,597 | 8,515 | 8,367 |
Student Achievement
Percentage of first time in college students completing program-level math & writing requirements in year one
These student cohorts are new first time in college credit students seeking a Lane credential of 1 year or longer who have (self-reported) not previously attended college. These students started in Fall term. Program-level means a course specifically required for the student’s declared program. The terms “program-level” and “gateway” may be used interchangeably but note that for some career technical credentials, program-level math courses may be below 100-level. Successful completion is a grade of P or C- or better.
Math
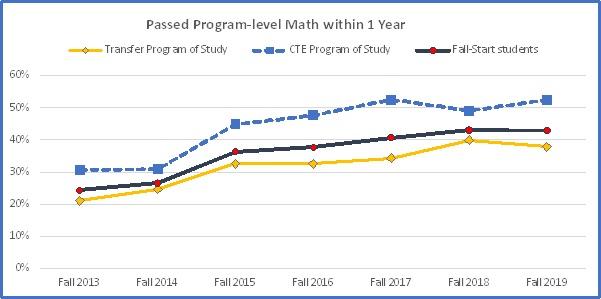
Lane’s one-year program-level math completion rate increased over the last 5 years, from 24% for the 2013 cohort to 43% for the 2019 cohort. An increase in 9 percentage points was seen between the 2014 and 2015 cohorts. Early gateway math completion builds a foundation for academic and career success and is known as a predictive key indicator correlated with graduation.
| Year/Category | Fall 2013 | Fall 2014 | Fall 2015 | Fall 2016 | Fall 2017 | Fall 2018 | Fall 2019 |
|---|---|---|---|---|---|---|---|
| Fall-start students | 24% | 27% | 36% | 38% | 41% | 43% | 43% |
| Transfer Program of Study | 21% | 25% | 33% | 33% | 34% | 40% | 38% |
| CTE program of study | 31% | 31% | 45% | 48% | 53% | 49% | 52% |
Writing
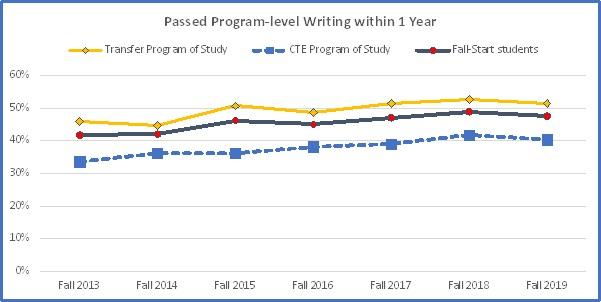
Lane’s one-year program-level writing completion rate improved in four of the last five years, increasing from 42% for the 2013 cohort to 48% for the 2019 cohort. Early gateway writing completion builds a foundation for academic and career success and is known as a predictive key indicator correlated with graduation.
| Year/Category | Fall 2013 | Fall 2014 | Fall 2015 | Fall 2016 | Fall 2017 | Fall 2018 | Fall 2019 |
|---|---|---|---|---|---|---|---|
| Fall-start students | 42% | 42% | 46% | 45% | 47% | 49% | 48% |
| Transfer Program of Study | 46% | 45% | 51% | 49% | 51% | 53% | 51% |
| CTE Program of Study | 34% | 36% | 36% | 38% | 39% | 42% | 40% |
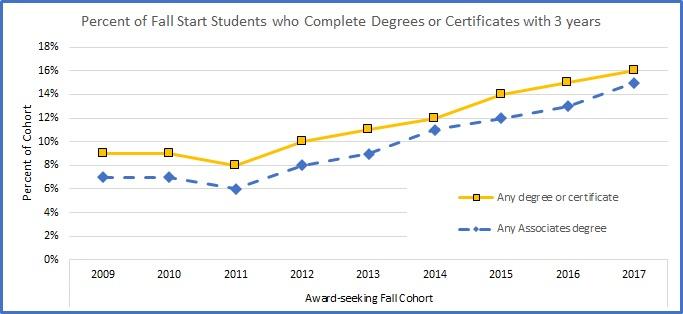
Percent of Fall Start Students who Complete Degrees or Certificates with 3 years
This graph shows how many Lane students completed a Lane credential within 3 years, for fall cohorts starting from fall 2009 to fall 2017 (AY09/10 to AY17/18). The award-seeking fall cohort includes any credit student seeking any credential of 1 year or longer. Awards are counted based on completion of requirements AND conferral of award. Approximately 1.4% of students completed an award within 3 years but conferral was delayed beyond the 3-year timeframe.
For example, from the new credit students seeking a credential of 1 year or longer who started in September 2017, 16.3% completed a degree or certificate by August 2020 and 14.6% completed an associate's degree.
| Year/Category | 2009 | 2010 | 2011 | 2012 | 2013 | 2014 | 2015 | 2016 | 2017 |
|---|---|---|---|---|---|---|---|---|---|
| Any degree or certificate | 9% | 9% | 8% | 10% | 11% | 12% | 14% | 15% | 16% |
| Any associate degree | 7% | 7% | 6% | 8% | 9% | 11% | 12% | 13% | 15% |
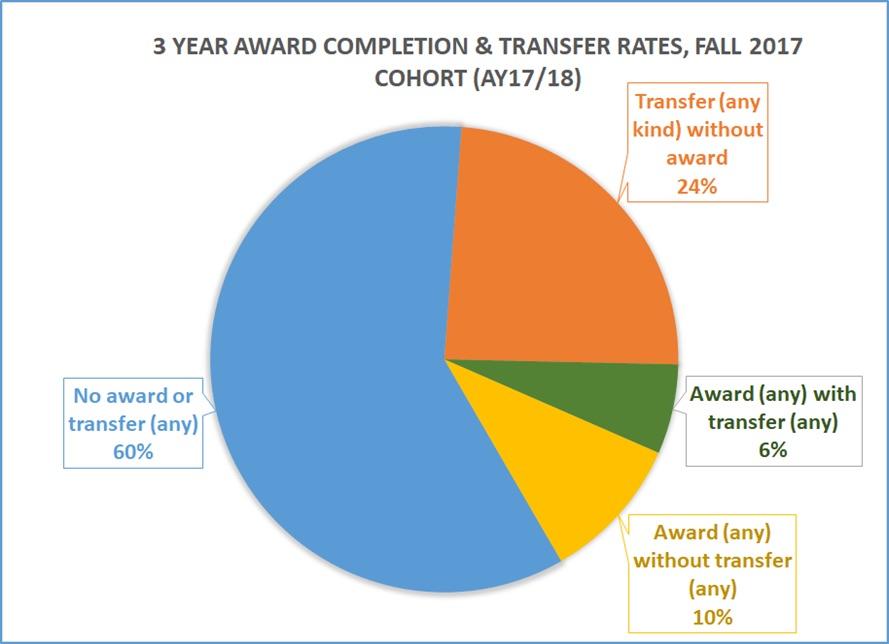
3 Year Award Completion & Transfer Rates for Fall 2017 Cohort of New Award-seeking Students
This pie chart shows the percentage of new award-seeking students from fall 2017 (AY17/18) that had completed a Lane credential and/or transferred to another college within 3 years (i.e., by the end of summer 2020).
| Award (any) without Transfer (any) | 10% |
|---|---|
| Award (any) with Transfer (any) | 6% |
| Transfer (any) without Award (any) | 24% |
| No Award or Transfer (any) | 60% |
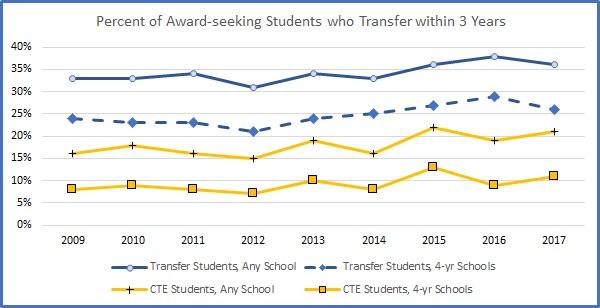
Percent of Award-seeking Students who Transfer within 3 Years
This graph shows how many award-seeking Lane students transferred to another college within 3 years, for fall cohorts starting from fall 2009 to fall 2017 (AY09/10 to AY17/18). Rates for transfer and CTE students are shown separately.
| Year/Category | 2009 | 2010 | 2011 | 2012 | 2013 | 2014 | 2015 | 2016 | 2017 |
|---|---|---|---|---|---|---|---|---|---|
| Transfer Students, Any School | 33% | 33% | 34% | 31% | 34% | 33% | 36% | 38% | 36% |
| Transfer Students, 4-yr Schools | 23% | 24% | 23% | 21% | 24% | 25% | 27% | 29% | 26% |
| CTE Students, Any School | 16% | 18% | 16% | 15% | 19% | 16% | 22% | 19% | 21% |
| CTE Students, 4-yr Schools | 8% | 9% | 8% | 7% | 10% | 8% | 13% | 9% | 11% |